Skip Navigation or Skip to Content

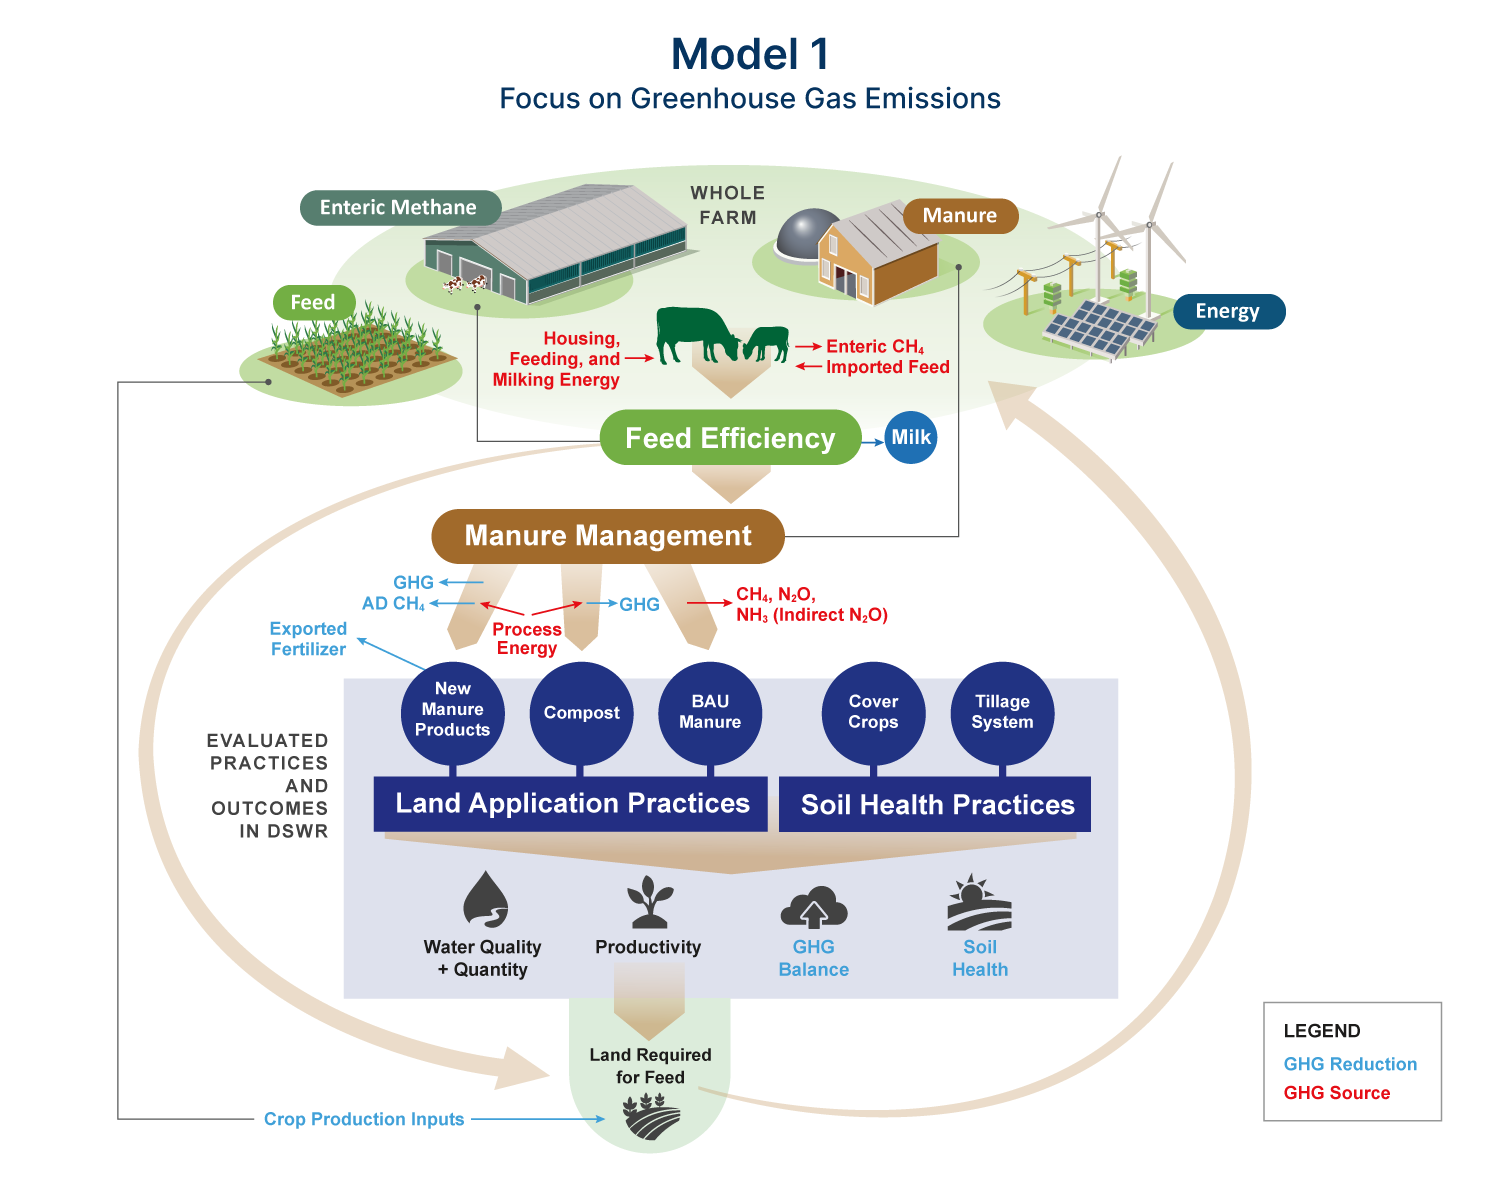
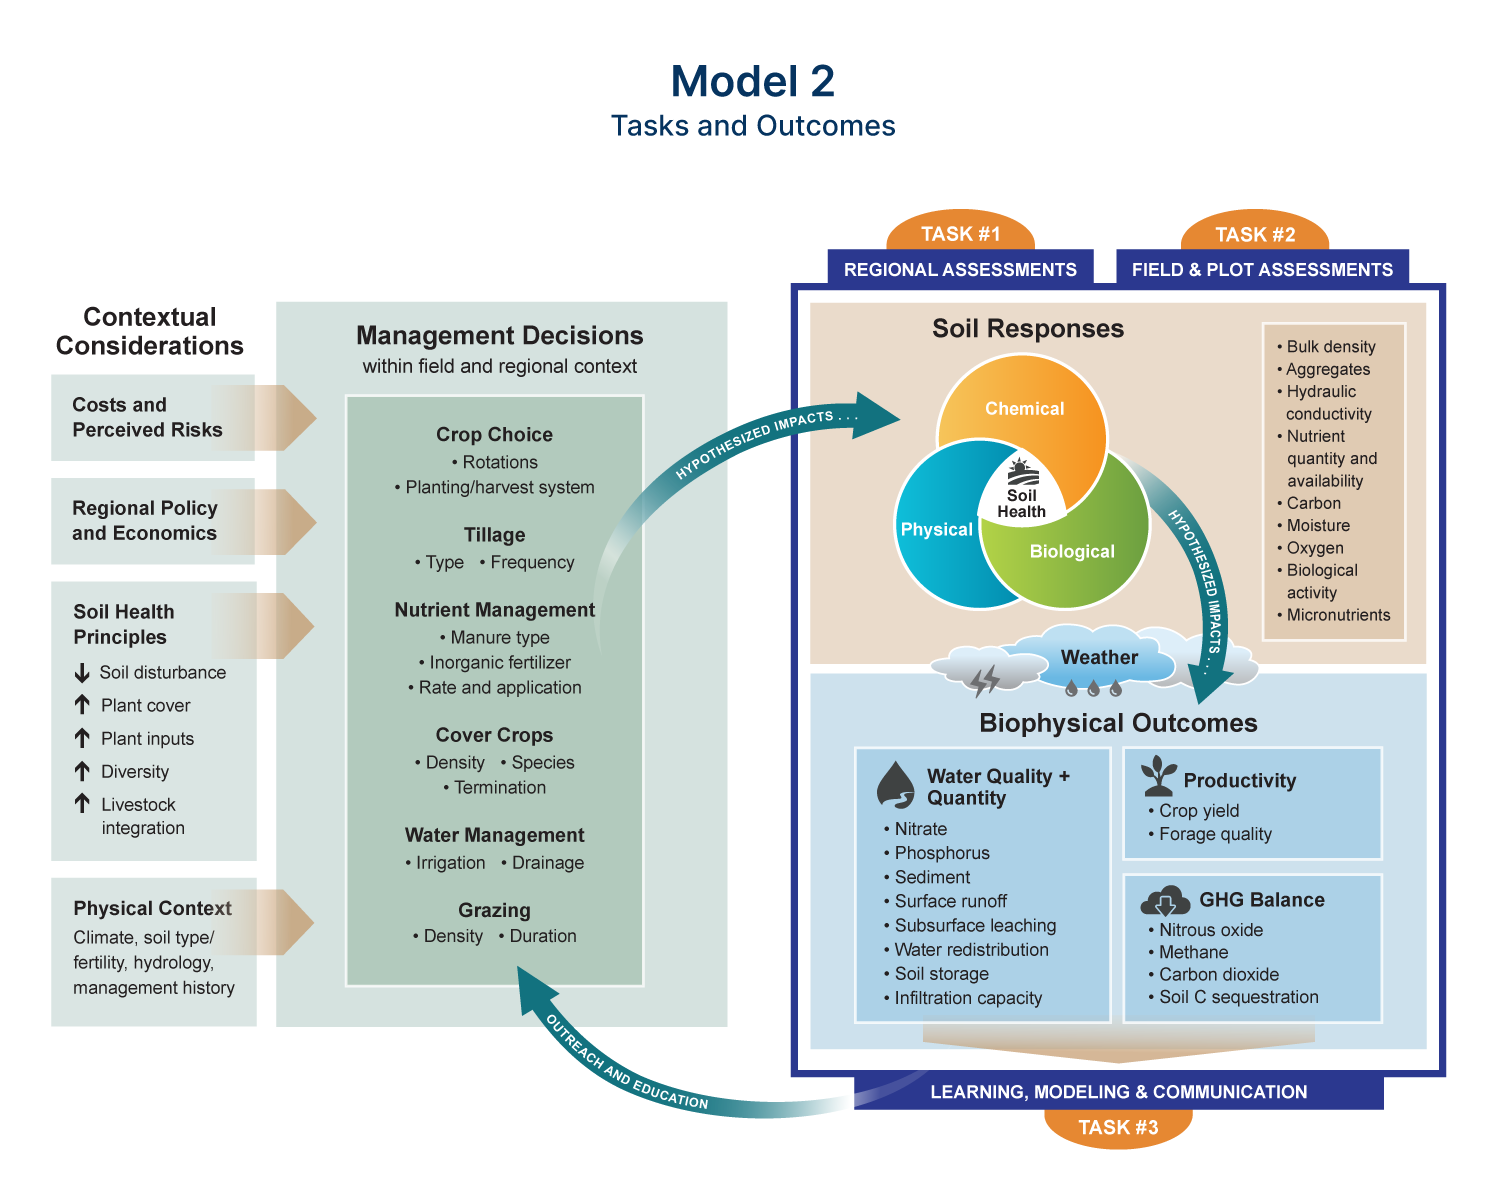
Conceptual models are tools used to simplify a complex system by visualizing key components and their interconnections. These models can range from diagrams depicting physical processes at a field site, such as the flow of water through the subsurface, to workflow diagrams that illustrate relationships among different activities and measurements within a project. Conceptual models are useful for visualizing hypotheses and developing shared understanding of a system.

Two conceptual models were developed in DSWR to help illustrate how the various measurements and activities in the project are supporting overall project aims. These models are “living documents” that will continue to evolve as researchers collect more data.

Greenhouse gas emissions infographic

DSWR and Greenhouse Gas Emissions

This model shows how DSWR fits into the broader U.S. Dairy Net Zero Initiative (NZI) by connecting the practices and outcomes evaluated in DSWR to the key sources of greenhouse gases (GHGs) within the dairy industry, represented as the “whole farm” at the top of the model.

  • Red and blue colors show hypothesized GHG sources and reductions, respectively, particularly associated with different manure products used in the project.
    • For example, this project hypothesizes new manure products will decrease methane (CH4) emissions but require increased processing energy.
  • Since DSWR is primarily focused on the feed production aspect of dairy systems, this diagram also shows links to other components of the NZI.
    • For example, the project hypothesizes that soil health management systems will improve crop productivity, potentially reducing the land requirements for dairy feed production and ultimately reducing the GHG footprint of the dairy industry.
  • Data collected during this project will help determine if soil health management, alternative manure products and land application practices will reduce the GHG footprint of dairy feed production.
Tasks and outcomes infographic

DSWR Activities

This diagram highlights the interconnections and hypotheses linking management decisions, soil health responses and the biophysical outcomes being measured and modeled in each of the project’s three tasks.

  • Most of the project measurements in Task 1 and Task 2 are focused on quantifying two links shown here:
    • The impact of management decisions on chemical, physical and biological indicators of soil health.
    • The degree to which soil health affects biophysical outcomes such as water quantity and quality, crop production and the GHG balance.
  • Task 3 will link the knowledge generated from DSWR’s studies back to decision-making through outreach, education and modeling.
  • Many factors affecting soil health and crop yield are outside of the control of the project, such as weather, policy and climate. These external factors also can affect soil health and biophysical outcomes.
    • Having a multi-year, multi-site study will help account for differences in weather, climate, policy and other factors and develop more generalizable insights.
  • The soil health and biophysical outcome responses to management are likely to vary in direction and magnitude between sites. As the project continues to collect data, it will use this model to identify similarities and differences across sites and regions.